Overview
Most creators and businesses measure social media performance by reach, impressions, and follower growth. These numbers are visible, easy to track inside each platform, and satisfying to watch grow. They are also deeply misleading if your actual goal is revenue or client acquisition.
The metric that matters is not how many people saw your content. It is how many people, having seen your content, took a step toward becoming a customer, client, or subscriber. Bio link analytics measure exactly this — and the results are frequently surprising.
Why platform-native analytics are not enough
Every social platform provides analytics that measure activity within that platform: impressions, reach, saves, shares, profile visits. What they do not show is what happens after a visitor clicks your bio link.
A post might drive 2,000 profile visits but only 40 bio link clicks and 3 actual leads. Another post might drive 400 profile visits but 80 bio link clicks and 25 leads. Platform analytics would show the first post as the better performer. Bio link analytics would correctly identify the second post as more than eight times more valuable.
Without tracking what happens at the bio link level, you are making content and channel investment decisions based on data that stops at the wrong point in the journey.
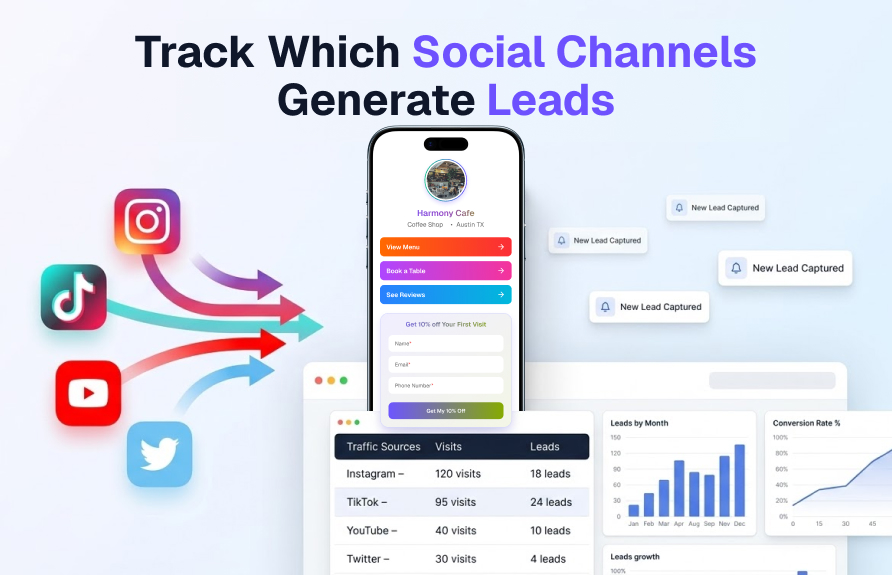
What BioLeads analytics track
Page views
The total number of times your bio page was loaded, broken down by day, week, and month. This gives you a baseline for how much traffic your bio link is receiving across all sources.
Link clicks
Which specific links on your bio page are being clicked, how often, and when. This shows you which of your destinations — your website, your YouTube channel, your product page — are attracting the most interest from the people who reach your bio page.
Lead capture rate
The percentage of bio page visitors who complete your lead form. This is your conversion rate at the bio link stage. A typical lead capture rate for a well-optimised bio page sits between 15 and 35 percent. If yours is below 10 percent, the form offer or the form placement needs work.
Traffic sources
Where your bio page visitors are coming from before they arrive. BioLeads identifies whether visitors came from Instagram, TikTok, Twitter, YouTube, direct links, or other sources. This is the data that tells you which channels are actually producing leads versus which are only producing impressions.
Device breakdown
The split between mobile and desktop visitors. For most creators, the mobile percentage will be above 80 percent. This confirms the importance of mobile-optimised page design and short, easy-to-complete forms.
Lead records with source attribution
Every lead captured through BioLeads includes the source data at the time of capture. You can see not just that a lead came in, but which platform they came from, which link they clicked, and when. This creates a complete picture of your lead acquisition pathway.
How to use source analytics to improve your content strategy
The most valuable use of bio link analytics is not measuring performance for its own sake — it is using the data to make better decisions about where to invest your content creation time.
Here is a simple weekly review process:
- Compare lead-per-visit rates by source. Divide the number of leads from each source by the number of visits from that source. This gives you a lead conversion rate per channel. The channel with the highest rate deserves more content investment.
- Identify your highest-converting link. The link on your bio page that gets the most clicks is a signal of what your audience wants most. If it is consistently your course page, your audience is in buying mode. If it is consistently your free resource, they are still in research mode. This shapes how you pitch in your content.
- Watch for traffic spikes. A sudden increase in bio page visits usually corresponds to a specific piece of content that performed well. Identify which post caused the spike and produce similar content.
- Track conversion rate trends. If your lead capture rate drops over several weeks, something has changed — either traffic quality has shifted, your offer has become less relevant, or a competitor has launched a similar offer. Investigate and adjust.
Exporting and using your lead data
BioLeads allows you to export your lead records as a CSV file on supported plans. This means you can import your captured leads directly into your email marketing tool — Mailchimp, ConvertKit, ActiveCampaign, or any platform that accepts CSV imports — and begin your follow-up sequence immediately.
The export includes name, email, phone (if collected), the source the lead came from, and the timestamp of capture. This is enough information to segment your list by source and personalise your follow-up messaging — for example, sending a slightly different welcome sequence to leads from Instagram versus leads from LinkedIn.
What to do next
- Set up BioLeads and run it for two weeks before drawing conclusions — you need enough data to see patterns.
- Review source analytics weekly and note which channels produce the highest lead-per-visit rate.
- Check your lead capture rate. If it is below 15 percent, test a new offer headline on your form.
- Export your lead CSV monthly and import it into your email marketing tool.
- Use link click data to understand what your audience wants most and create content that meets that demand.
Analytics are only useful if they change behaviour. Use the data from your bio link to make one specific change each week — a new offer, a different link order, a content type shift — and measure whether the lead rate improves. Start tracking your bio link performance free on BioLeads.

Company
Product Team at BioLeads
BioLeads is built and maintained by Approid Tech, a software product company helping creators, consultants, and small businesses turn social traffic into organised leads.
Share this article